|
😘 Kiss bugs goodbye with fully automated end-to-end test coverage (Sponsored)
 |
Bugs sneak out when less than 80% of user flows are tested before shipping. However, getting that kind of coverage (and staying there) is hard and pricey for any team.
QA Wolf’s AI-native service provides high-volume, high-speed test coverage for web and mobile apps, reducing your organization’s QA cycle to less than 15 minutes.
They can get you:
24-hour maintenance and on-demand test creation
Zero flakes, guaranteed
Engineering teams move faster, releases stay on track, and testing happens automatically—so developers can focus on building, not debugging.
Drata’s team of 80+ engineers achieved 4x more test cases and 86% faster QA cycles.
⭐ Rated 4.8/5 on G2.
We’ve all been there. Our code works perfectly, passes all tests, and does exactly what it’s supposed to do. Then we deploy it to production and realize it takes 10 seconds to load a page when users expect instant results. Or worse, it works fine with test data but crawls to a halt with real-world volumes.
The common reaction is to think about optimizing later, or leaving performance tuning for experts. Both assumptions are wrong. The truth is that writing reasonably fast code doesn’t require advanced computer science knowledge or years of experience. It requires developing an intuition about where performance matters and learning some fundamental principles.
Many developers have heard the famous quote about premature optimization being “the root of all evil.” However, this quote from Donald Knuth is almost always taken out of context. The full statement reads: “We should forget about small efficiencies, say about 97% of the time: premature optimization is the root of all evil. Yet we should not pass up our opportunities in that critical 3%”.
This article is about that critical 3%, where we’ll explore how to estimate performance impact, when to measure, what to look for, and practical techniques that work across different programming languages.
Learning to Estimate
One of the most valuable skills in performance-aware development is the ability to estimate rough performance costs before writing code. We don’t need precise measurements at this stage, but we just need to understand orders of magnitude.
Think of computer operations as existing in different speed tiers. At the fastest tier, we have CPU cache access, which happens in nanoseconds. These are operations where the data is already sitting right next to the processor, ready to be used. One tier slower is accessing main memory (RAM), which takes roughly 100 times longer than cache access. Moving down the hierarchy, reading from an SSD might take 40,000 times longer than a cache access. Network operations take even longer, and traditional spinning disk seeks can be millions of times slower than working with cached data.
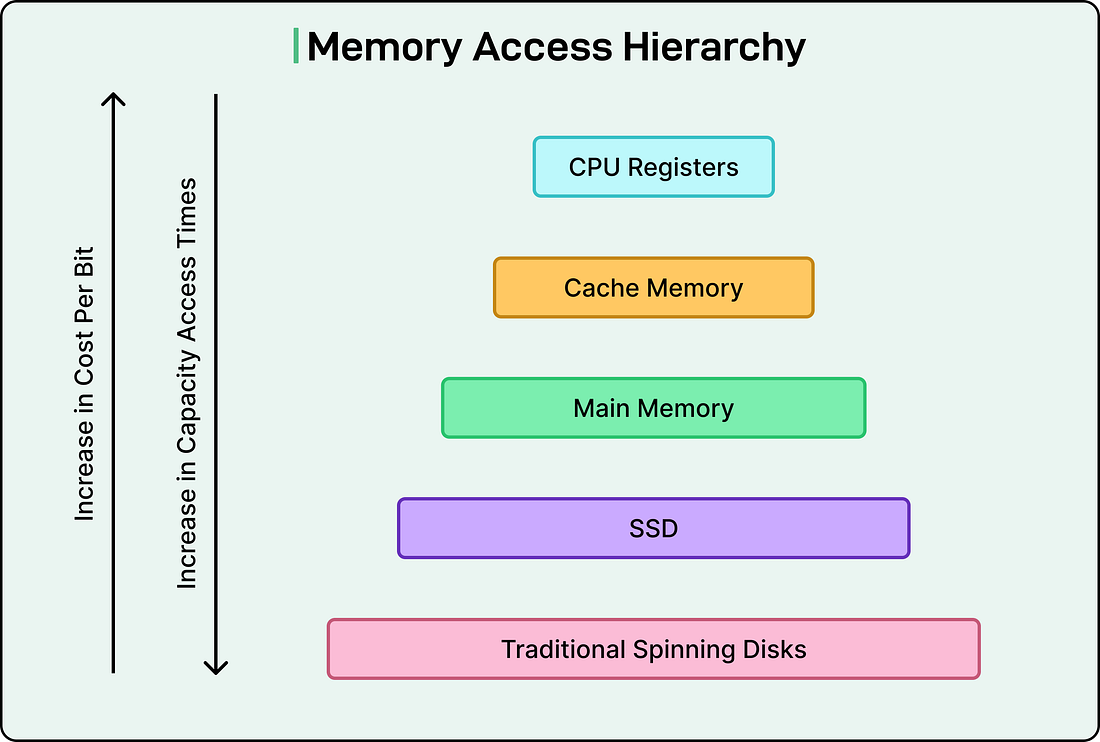 |
This matters because for designing a system that needs to process a million records, the architecture should look completely different depending on whether that data comes from memory, disk, or a network call. A simple back-of-the-envelope calculation can tell us whether a proposed solution will take seconds, minutes, or hours.
Here’s a practical example. Suppose we need to process one million user records. If each record requires a network call to a database, and each call takes 50 milliseconds, we’re looking at 50 million milliseconds, or about 14 hours. However, if we can batch those requests and fetch 1000 records per call, suddenly we only need 1000 calls, which takes about 50 seconds.
Measure Before We Optimize
Our intuition about performance bottlenecks is usually wrong. We might spend days optimizing a function we think is slow, only to discover through profiling that some completely different part of the code is the actual problem.
This is why the main rule of performance optimization is to measure first and optimize second. Modern programming languages and platforms provide excellent profiling tools that show us exactly where our program spends its time. These tools track CPU usage, memory allocations, I/O operations, and lock contention in multi-threaded programs.
The basic profiling approach is straightforward.
First, we run our program under a profiler using realistic workloads, not toy examples. The profile shows us which functions consume the most time.
Sometimes, however, we encounter what’s called a flat profile. This is when no single function dominates the runtime. Instead, many functions each contribute a small percentage. This situation is actually common in mature codebases where the obvious bottlenecks have already been fixed. When facing a flat profile, our strategy shifts. We look for patterns across multiple functions, consider structural changes higher up in the call chain, or focus on accumulating many small improvements rather than one big win.
The key point is that we should let data guide our optimization decisions.
Algorithmic Wins
The most important performance improvements almost always come from choosing better algorithms and data structures. A better algorithm can provide a 10x or 100x speedup, dwarfing any micro-optimization we make.
Consider a common scenario: we have two lists and need to find which items from the first list exist in the second. The naive approach uses nested loops. For each item in list A, we scan through all of list B looking for a match. If each list has 1000 items, that’s potentially one million comparisons. This is an O(N²) algorithm, meaning the work grows with the square of the input size.