|
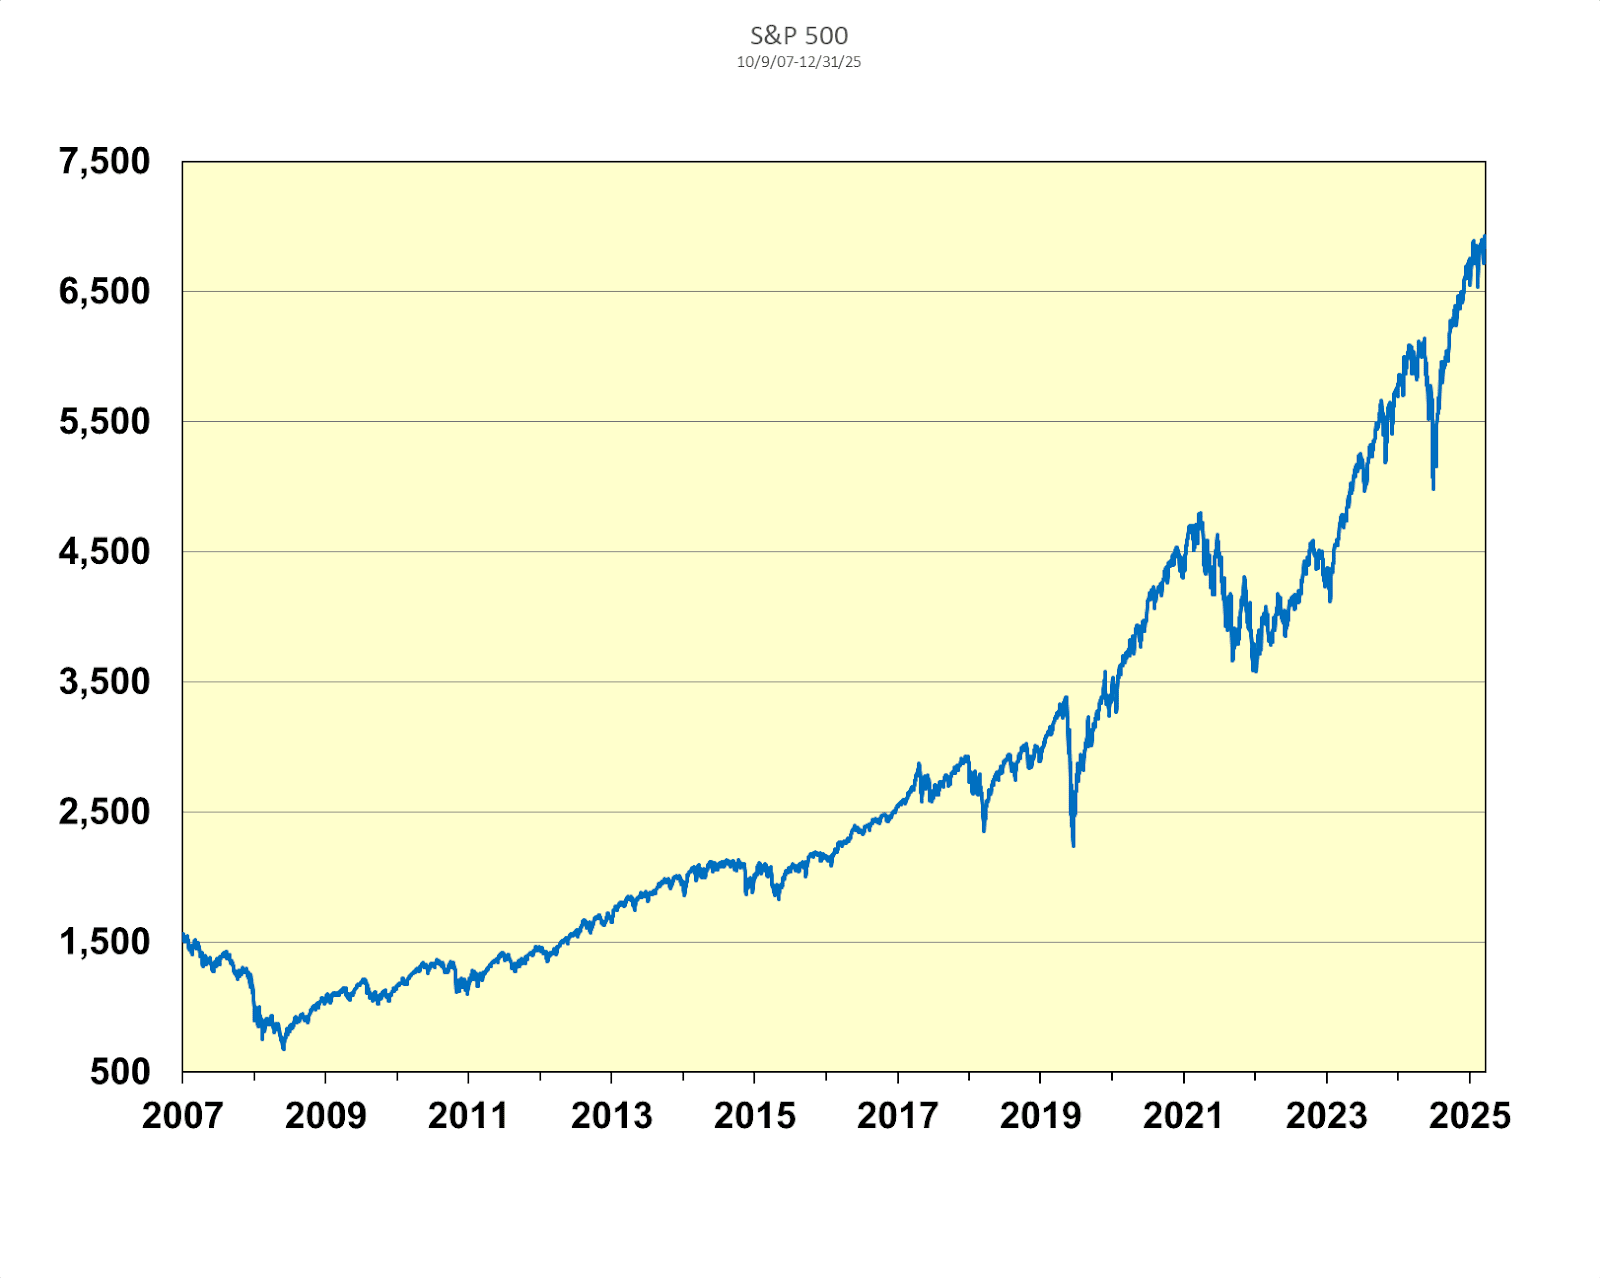
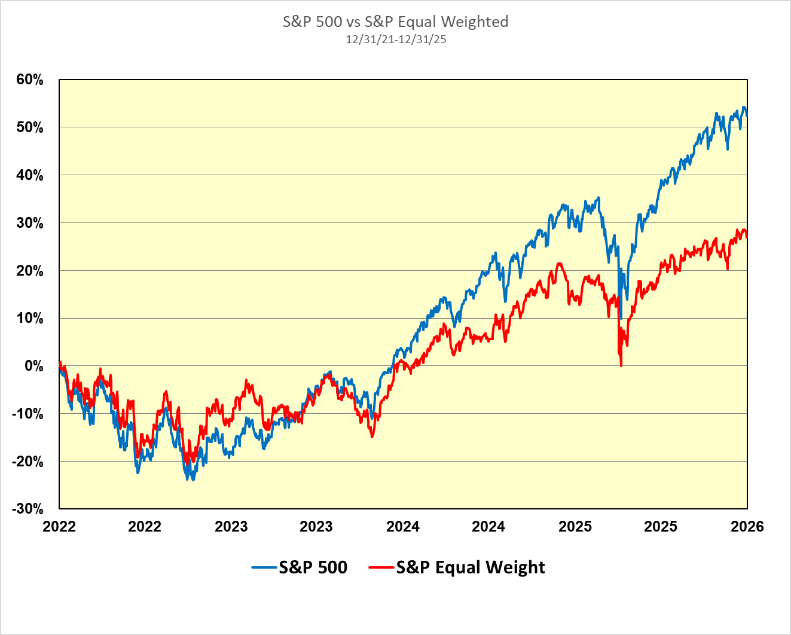
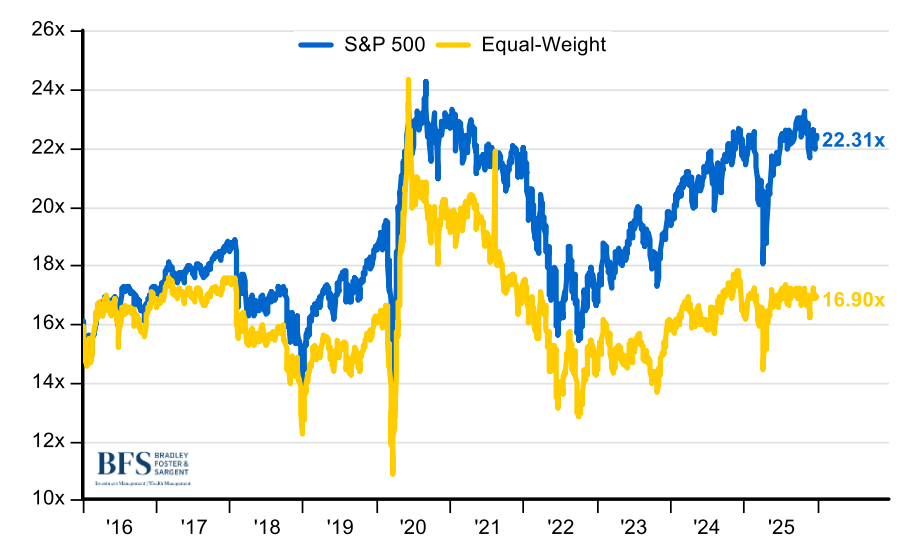
"Let me again suggest that the future has never been clear to me (give us a call when the next few months are obvious to you — or, for that matter, the next few hours)." — Warren Buffett, 1966 For many of us in the investment business, the first question that is often asked of us by clients and friends is: “Where is the market headed?” It seems an entirely appropriate question to be directed to investment professionals, since a large percentage of our waking hours is spent analyzing companies, industries, sectors of the stock market, and the stock market itself. When asked this question, it is, therefore, not surprising for many investment professionals to sound knowledgeable about the direction of the stock market — either because they think they can accurately forecast its short-term future behavior, or because it might be embarrassing for them to admit that they don’t know where the stock market is headed. At Bradley, Foster & Sargent Inc., however, we are not uncomfortable admitting that we don’t know which way the stock market is headed over the short term. And we find ourselves in very good company in this regard. What do investors such as Warren Buffett, Peter Lynch, and John Templeton have in common? All say that it is impossible to predict the direction of the stock market in the short term with any degree of regularity. Since the inception of the Standard & Poor's 500 Index in 1926, the Index has had a compound annual growth rate of nearly 11 percent (doubling roughly every seven years). And we believe the stock market will continue to reward investors with similar kinds of return well into the future, unless the country deviates from its engine of democratic capitalism, which has caused the United States to be the wealthiest country in the history of the world. Secular and Cyclical Bull Markets As we described in our last quarterly investment commentary, investors have been living in a “golden age” since the market bottomed in March 2009. In two months, this secular bull market will be 17 years old. During this period, the S&P 500 Index has advanced more than twelve-fold (total return). The chart on the following page illustrates one of the great secular bull markets in our history: Secular Bull Market S&P 500 Index 2007-2025 Source: Bloomberg It is important to differentiate between secular and cyclical bull markets. A secular bull market is a broad, multi-decade trend of rising stock prices driven by major structural shifts (such as technology), while a cyclical bull market is a shorter-term (often lasting a few years) uptrend occurring within a secular trend, often mirroring business cycles and experiencing smaller peaks and troughs. The U.S. stock market has been in a cyclical bull market for the past three years. Following the market downturn in 2022, when the S&P 500 had a total return of -18.1 percent, the market advanced robustly during the last three years, with the S&P 500 turning in a cumulative total return of 86.1 percent. Thus, long-term stock market investors have been the fortunate beneficiaries of both a long-running secular bull market and the recent cyclical bull market, as the chart below demonstrates: Cyclical Bull Market S&P 500 Index 2022-2025 Source: Bloomberg Where Do We Go From Here? But we don’t want to become complacent. As we have written before, trees don’t grow to heaven. Inevitably, things happen that cause the market to sell off. In order to plot a course forward, we need to know where we have been and where we stand now. The late historian David McCullough once wrote: “A wise historian once said that to try to plan for the future without a sense of the past is like trying to plant cut flowers.” As we move into 2026, let’s take a look at the current state of play. Currently, the valuation (price/earnings ratio) of the stock market is elevated by every measure. The chart below shows the rich stock market valuation compared with historical norms. While the market’s price/earnings ratio of around 22.3 on 2026 operating earnings is somewhat less than the extremes reached at the top of the “Internet bubble” in 2000, it is nonetheless 20 to 30 percent above historical averages. However, the good news is that the S&P 500 Equal Weight Index (which removes the unhealthy concentration of the top 10 stocks in the S&P) is trading at a much more reasonable valuation. The chart below shows this dichotomy: S&P 500 vs. S&P Equal Weight Index 2016-2025 Source: S&P, Invesco, FactSet In the most fundamental sense, stock markets (and stocks for that matter) advance because of two basic variables: earnings and valuations (prove/earnings ratios). If earnings grow while the price/earnings ratio remains stable, the market will advance in line with the earnings growth. If earnings remain flat but valuations increase, the market will advance in line with the expansion of the price/earnings ratio. If both earnings grow and valuations increase, one has the best of all worlds, as the market advances both from earnings growth and multiple expansion — a double whammy. Most analysts do not believe that the stock market’s price/earnings ratio will expand in 2026; it is already extended. But they seem comfortable with the elevated valuation and are not predicting a contraction. It seemingly appears as if investors have embraced a new paradigm in which the market’s price/earnings ratio should be 20 or more — well above the historical average of around 16.5 over the past 50 years. But once in a long while a paradigm shift does occur. During the latter half of the 19th century and the first half of the 20th century, there was such a paradigm shift. Until the early 1950s, U.S. investors required equities to have higher dividend yields than bond yields to compensate for equities’ inherently greater risk over investment grade bonds. Dividend yields dropped below bond yields, as investors prioritized the growth potential of stocks over bonds’ fixed yields. Moreover, companies began to reinvest profits instead of paying higher dividends, shifting the perceived risk-reward balance. This created a new norm where lower stock yields were acceptable — a complete reversal from the previous decades. Are we witnessing a new paradigm shift? It has usually been dangerous for investors to believe that “things are different this time” — that there will be no reversion to the mean. But a paradigm shift wherein investors believe that equity valuations do not conform to the old rules is indeed possible. Perhaps stock market price/earnings ratios of 20 to 23 are the new norm. To be clear, we at Bradley, Foster & Sargent do not yet embrace this new norm, but it is certainly within the realm of possibility. Thus, while investors are not forecasting an expansion of the market’s price/earnings ratio, they do forecast that corporate earnings will grow by high single digits or even by 10 percent this year. If the stock market multiple remains flat but earnings grow 10 percent in 2026, the S&P 500 will indeed advance from 6,845, where it closed in 2025, to perhaps 7,500 or more. But, to reiterate, that forecast depends on two premises: that earnings grow nicely in 2026, and that the stock market’s valuation does not shrink but remains roughly the same price/earnings ratio of around 22.3. Bull Case There is a lot of investor enthusiasm about the stock market in 2026, with many analysts and pundits predicting a continuation of the bull market into 2026. What has to happen for the bulls to be right? Here is a brief list of things that need to occur: - Corporate earnings increase by high single digits or double digits
- Stock market valuation remains elevated
- Monetary easing (Federal Reserve cuts the Fed funds rate one or more times)
- Continued government fiscal stimulus (large deficit spending)
- Major corporations keep pledges to invest in manufacturing facilities in the United States (reshoring)
- Artificial Intelligence capital spending continues
- Artificial Intelligence capital spending leads to productivity increase and revenue growth at AI users
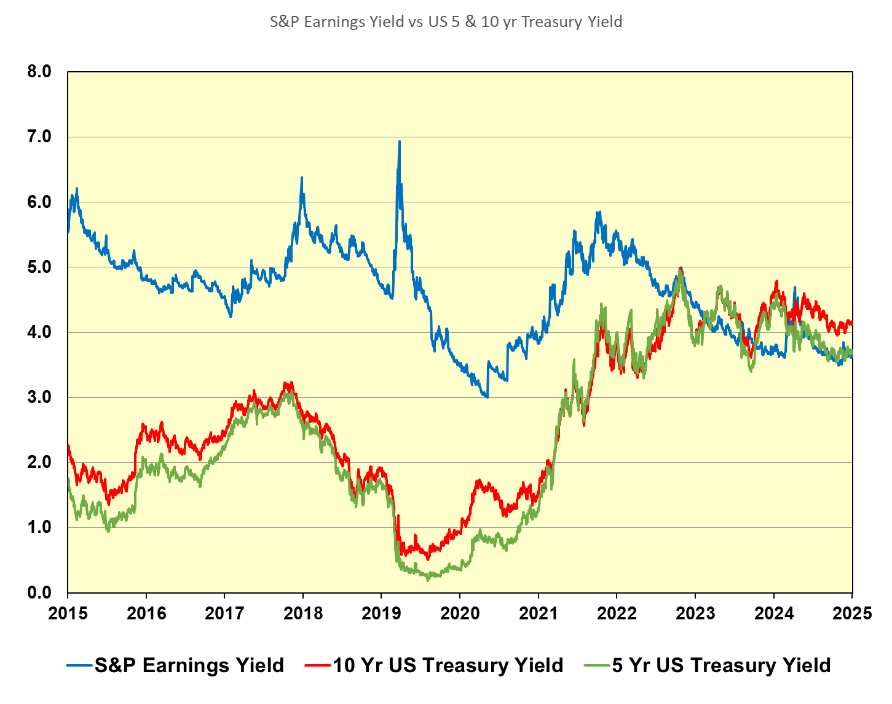
Bear Case The main reason why some investors are pessimistic about the stock market’s prospects in 2026 comes down to its expensive valuation. A good example of this pessimism is Berkshire Hathaway, which has amassed a war chest of $380 billion in cash and Treasury bills — dry powder for when valuations become more reasonable. In past commentaries, we have compared the earnings yield on the S&P 500 Index with the yields on the 10-year U.S. Treasury note. (The earnings yield is calculated by dividing the earnings or earnings per share by the price.) The chart on the following page shows the path of the earnings yield of the S&P 500 Index over the past 10 years compared with the yields on both the 5-Year U.S. Treasury note and the 10-Year U.S. Treasury note: S&P 500 Earnings Yield vs. U.S. Treasury Bonds Yields 2015-2025 Source: Bloomberg If investors are given the choice of investing in a risk-free 10-year U.S. Treasury note with a yield of 4.2 percent and the S&P 500 Index with an earnings yield of 4.3 percent, many investors will choose not to buy stocks, as the usual risk premium for stocks has disappeared. The parity between the earnings yield of the S&P 500 and U.S. Treasury notes is one of the fundamental facts supporting the bear case. In addition to the elevated stock market valuation, the list below chronicles other key reasons why some investors are not optimistic about the stock market in 2026: - A reversion to mean stock market valuations would mean a decline of 25 percent or more in the S&P 500 Index
- Corporate earnings may disappoint, not advancing 8 to 10 percent or more
- There is an unhealthy concentration of stocks, with the top 10 stocks making up 40 percent of the S&P 500 Index
- Artificial Intelligence optimism has peaked and will cool
- Artificial Intelligence capital expenditures will not produce hoped-for revenue and earnings
- Uncertainty surrounding the Trump tariffs
- Uncertainty regarding November 2026 mid-term elections
- Historically the stock market has done poorly in second year of the presidential term
- Geopolitical uncertainties in many corners of the world
Conclusion At Bradley, Foster & Sargent, we are not necessarily in the bears' camp. Despite the fact that valuations are stretched, bear markets don’t occur simply because of elevated valuations. Normally, something happens to cause the market to falter and then drop. Generally, one of the main causes of a bear market is a recession, but we do not foresee a recession in 2026. Often, the market sells off because of an interest rate tightening cycle initiated by the Federal Reserve, as was the case in 2022. We think a cycle of interest rate hikes is unlikely, as well. A bear market might also result from political events emanating from Washington, or a war or other geopolitical occurrences. Our crystal ball is cloudy in this regard. These economic and political unknowns are among the reasons why we do not believe it is possible to accurately forecast the action of the stock market over the short term with any degree of regularity. But as we are in the business of evaluating all the data and coming to actionable conclusions, we will hazard a prediction. As we anticipate neither a recession in 2026 nor rising inflation leading to significant interest rate hikes, we see the major indexes advancing in the high single digits in 2026 — an increase of perhaps 6 percent to 9 percent. If that were to happen, the S&P 500 would advance from 6,887 to somewhere in the range of 7,300 to 7,500. However, despite the absence of clouds on the horizon, we do believe that now is the time for a measure of caution. The elevated stock market valuation allows for little margin of safety. Moreover, we do not yet believe in a new normal — a paradigm shift — in valuing the stock market. Accordingly, we believe that it is appropriate to review asset allocations in portfolios, especially for those whose main goals are income distribution and capital preservation. Also, it is important to reduce the size of some technology and communication stock positions which have done very well but now represent outsized holdings. For those whose financial objectives call for long-term capital appreciation and where short-term volatility is not a major concern, the empirical evidence demonstrates that the path to wealth creation in the United States has been owning quality U.S. growth stocks, bought at a reasonable price. This investment approach, which we follow at Bradley, Foster & Sargent, has produced good results for our clients who have followed this path over the long term. Robert H. Bradley is Chairman of Bradley, Foster & Sargent Inc., a $9.2 billion wealth management firm with offices in Hartford, Connecticut; Wellesley, Massachusetts; and four other locations. He is the founding chairman of the Massachusetts Family Institute and currently serves as its vice chairman. Read other articles by him here.
|