Join Yacine Belamiri, Data Engineer at SOITEC, for Time to Innovate and learn how to explore your data interactively in a single environment. This on-demand session helps you:
Explore complex data sets quickly and generate reproducible insights.
Gain deeper understanding and confidence through visual analytics.
Identify trends, variability, and relationships without rebuilding analyses.
Communicate findings clearly to both technical and non-technical audiences.
New to data exploration? No problem – no prior experience is required.
Marketplace Extension of the Month: Calculate Effects Sizes
Each month, Newswire will highlight an extension available in the JMP Marketplace. This month, we are featuring the Python Data Connector Demo!
This add-in ingests estimates from an ordinary least squares report – produced by Fit Model – and saves a table of model effect estimates, F-ratios, p-values, and three measures of effect size as formula columns (eta squared, partial eta squared, omega squared).
If requested, the add-in also creates a table of pairwise effect sizes, confidence intervals, and false discovery rate-adjusted p-values. We invite you to explore Calculate Effects Sizes and other add-ins in the JMP Marketplace!
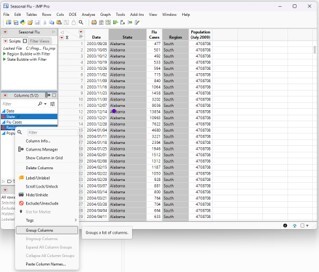
Follow these quick steps to group columns in your data table:
From the left Columns panel, click on the name of the first column you want to group, then use CTRL (Windows) or CMD (Mac) select the other columns.
Right-click on the highlighted columns in the Columns panel and select Group Columns.
JMP automatically generates a group name. NOTE: To change the group name, click on the name in the Columns panel, select Columns Manager, then rename it in the Name field.
If you want to ungroup, simply select the grouped column name in the panel, right-click, and select Ungroup Columns.