Matomo Analytics, the trusted ethical web analytics platform. |
Matomo 5.12 is here, with smarter charts and cleaner reports
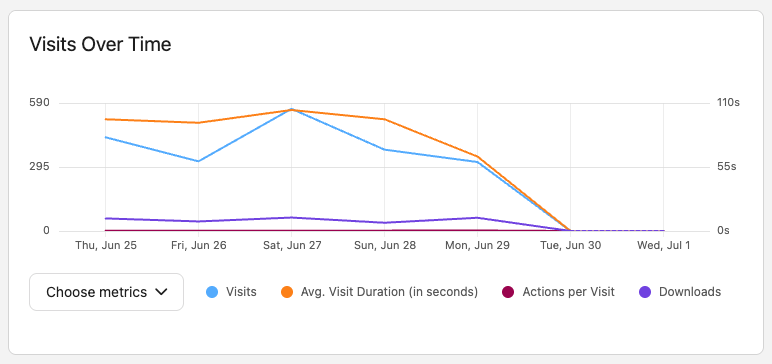
Matomo 5.12 is now available, with a refreshed reporting experience that makes your data easier to read at a glance: Charts, sparklines and report interactions have been modernised, so you can scan your metrics faster, compare performance more clearly and spot trends with less visual clutter. |
Here is what stands out in this release:
- A modern look for your reports, with redesigned charts and sparklines, clearer interactions and improved widget actions.
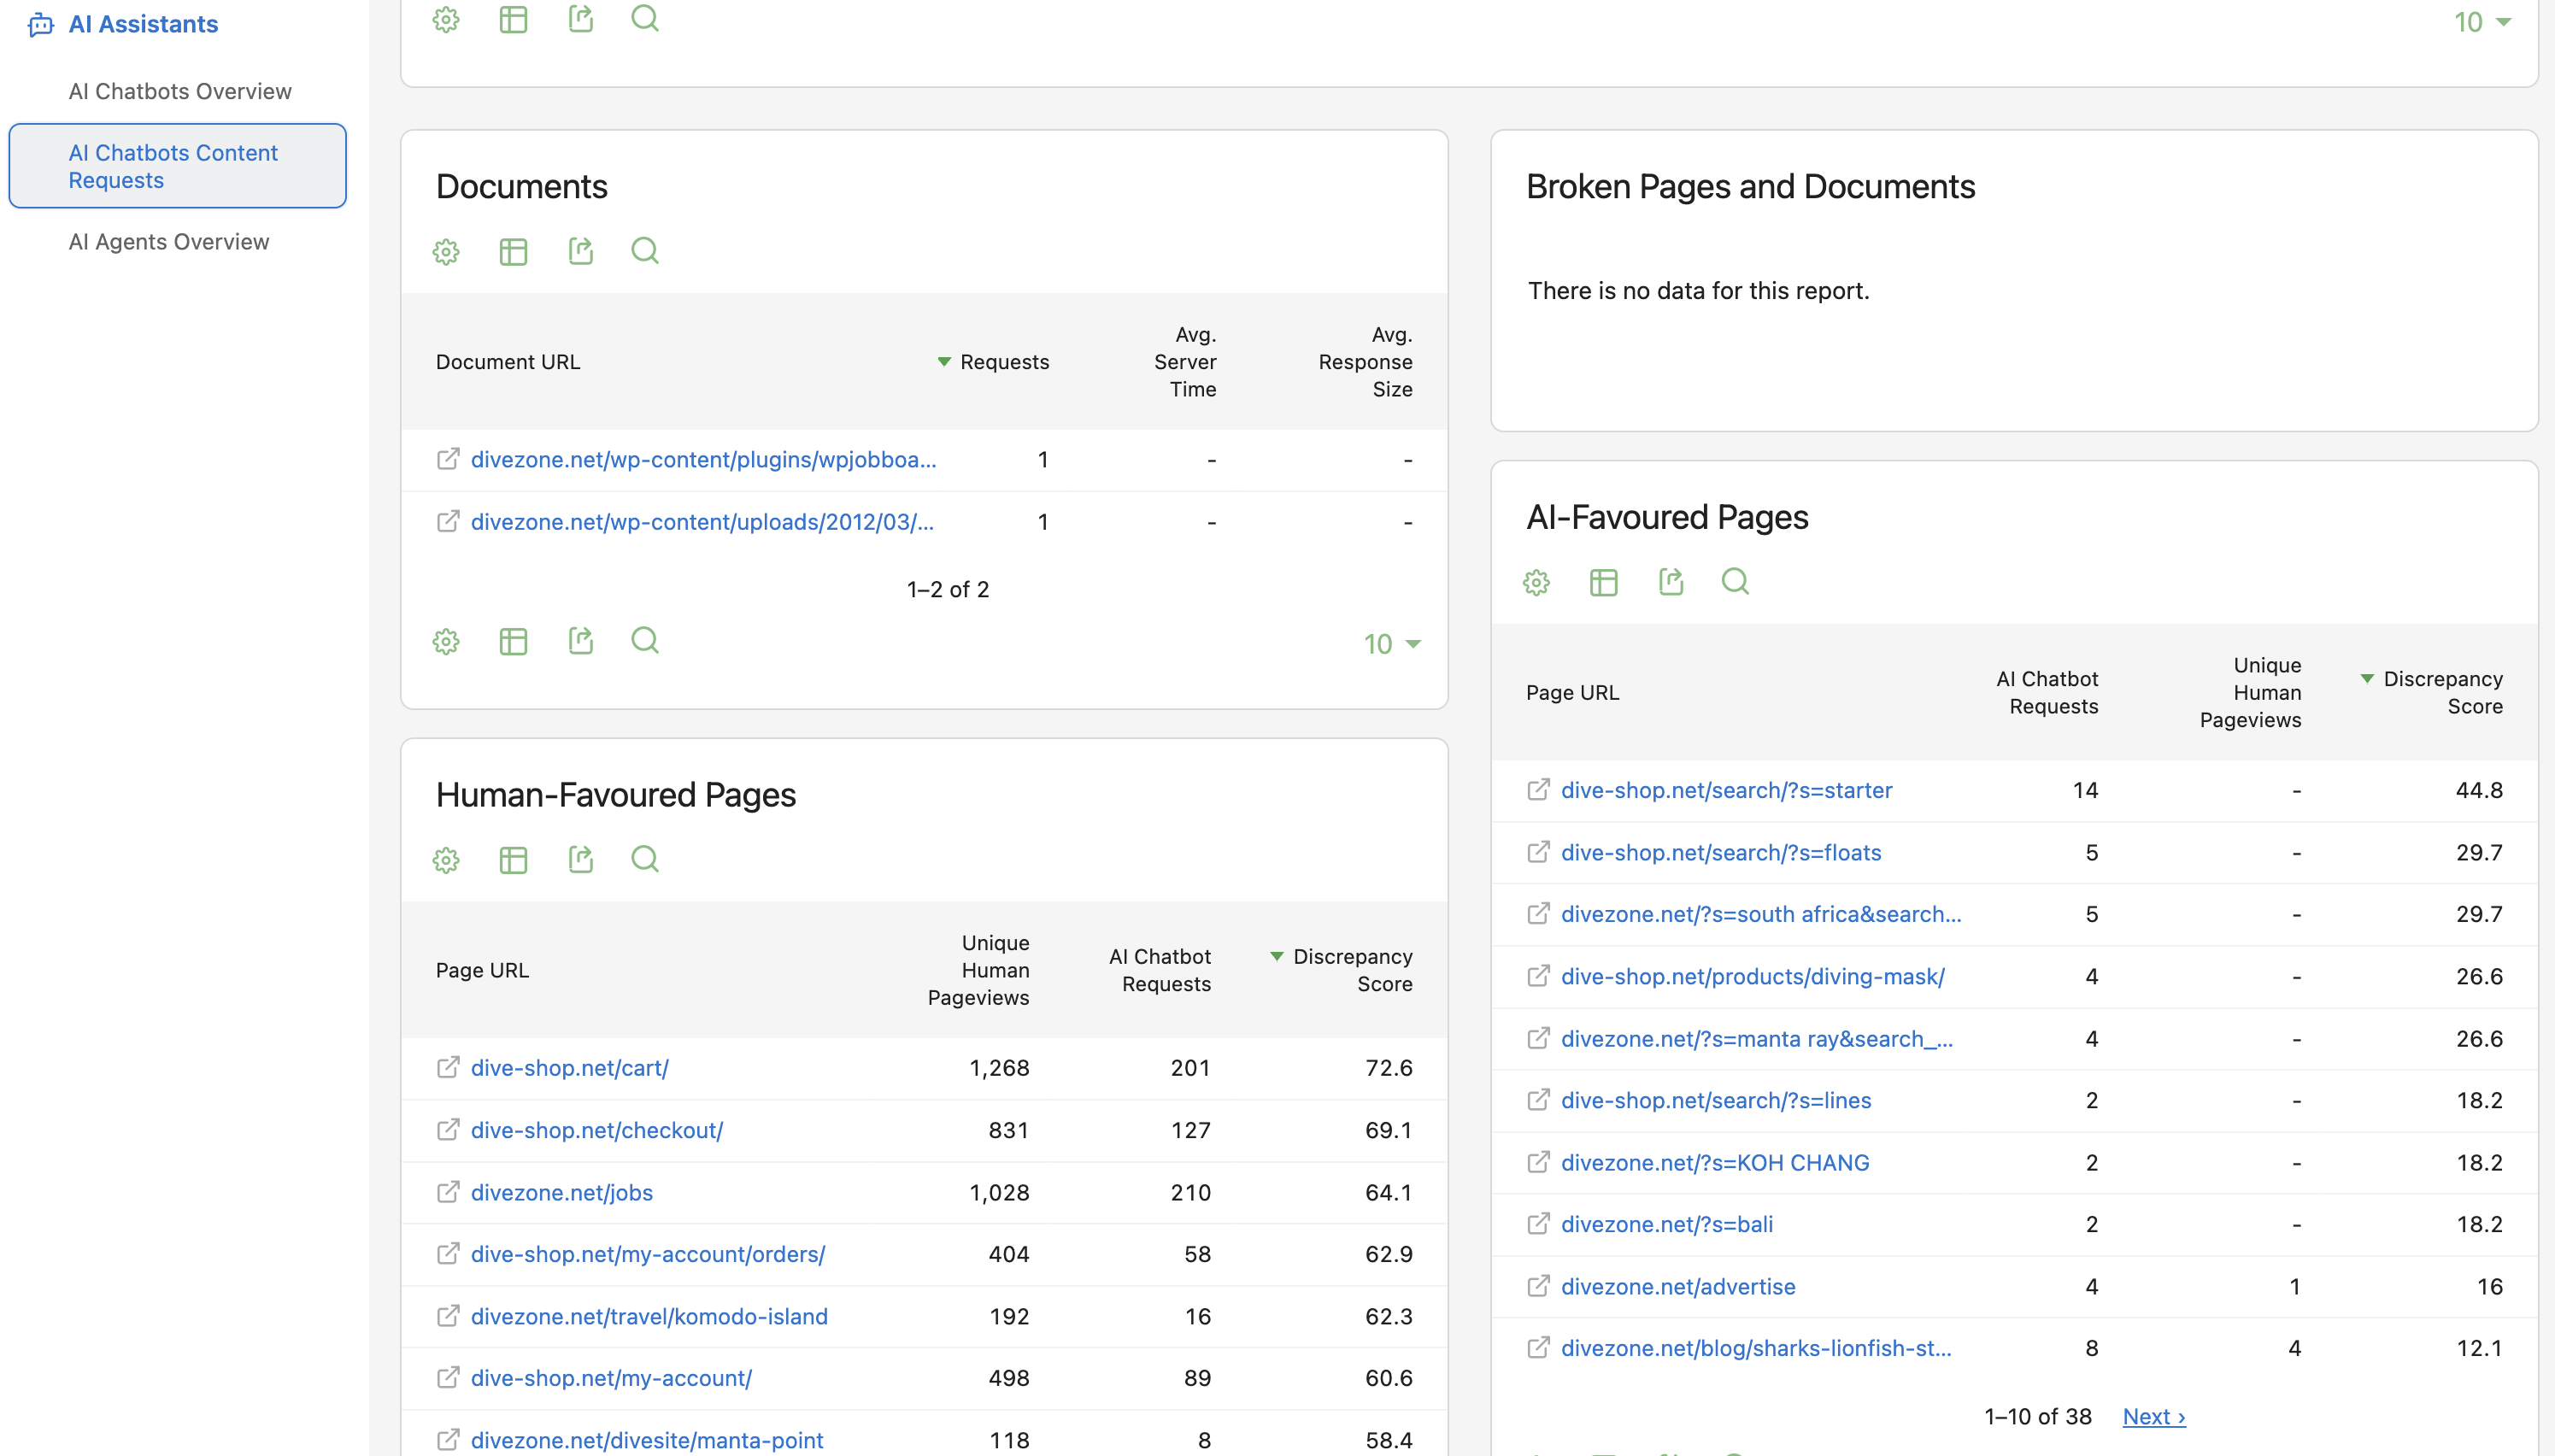
- New AI Chatbots Content Requests reports, to see which of your content AI chatbots access (more on this just below!).
- A range of smaller fixes and refinements across the platform.
If you run Matomo On-Premise, you can update now. On Matomo Cloud, these improvements are rolling out automatically. Together, these improvements make it easier to move from reports to insights, without getting lost in the details! |
Join our next webinar and get started with confidence |
Setting up your analytics the right way from day one saves a lot of guesswork later.
Join our live onboarding webinar on Thursday 30 July at 2:30pm CEST, hosted by Alex from the Matomo team, for a practical walkthrough of getting started with Matomo and getting more from your data. It is now a monthly session, so there is always a fresh chance to join. |
Here is what we will cover:
- The essentials to set up Matomo the right way from the start,
- Practical tips for your daily work,
- Time for your questions, answered live!
Whether you are new to Matomo or just want to check your setup is on the right track, you will have a clearer path forward. |
See which content AI chatbots request from your website |
Your biggest audience might not be human.
AI chatbots like ChatGPT, Claude and Perplexity can now access your website directly to answer questions for their users. But this activity does not always appear in your usual analytics reports.
That means you may not know which pages and documents AI chatbots request most, or whether they can access them at all.
|
Here is what you can do with them:
- See which pages and documents AI chatbots request most from your website.
- Spot broken pages and documents they cannot access, with 404 and 5xx errors flagged.
- Compare where AI and human interest differ, using the new Discrepancy Score.
From there, you can decide what to fix, update or optimise to keep your content visible and accessible in AI-assisted discovery.
The reports appear once AI Chatbot Tracking is set up. And as always with Matomo, your data stays under your control. |
Two new views to see where you win and lose conversions |
Every conversion depends on two key moments: the journey people follow, and the forms they complete.
Until now, comparing performance across funnels and forms meant opening each one separately, or relying on the Realtime report, with only a short window of data.
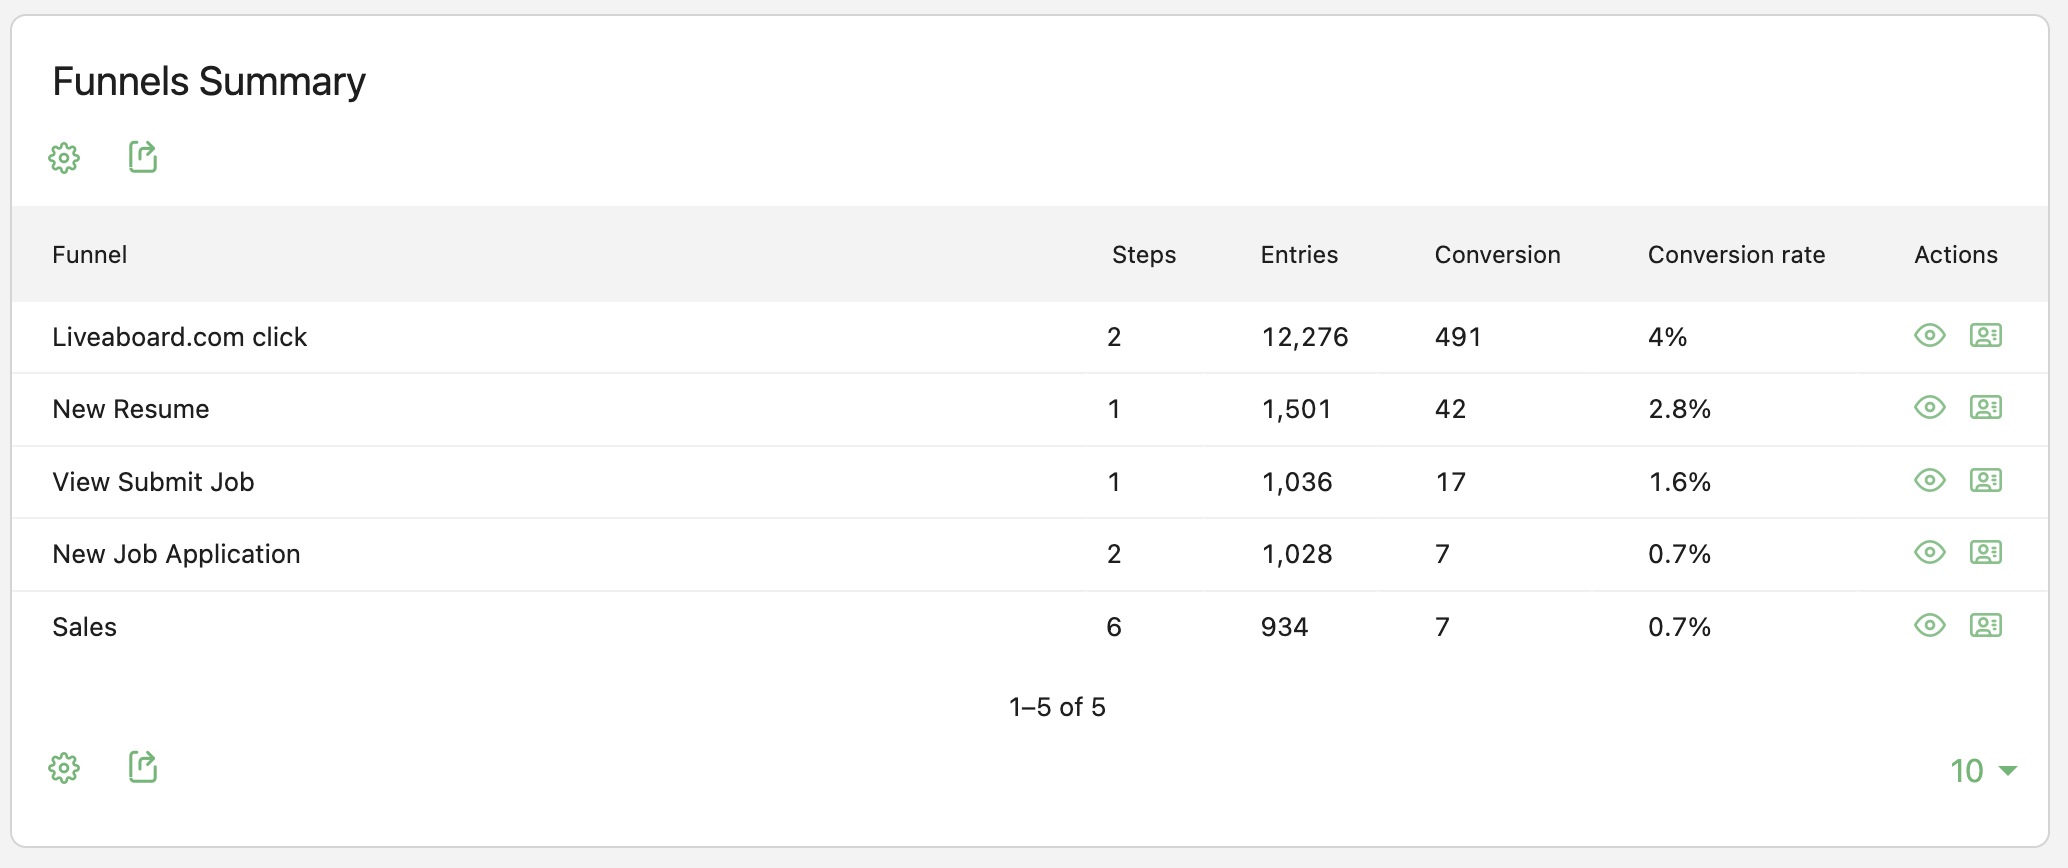
Matomo now adds a Summary table to both Forms and Funnels, so you can compare performance across any calendar period you choose.
Start with Funnels to see the journey. |
The new Funnels Summary table brings all your funnels into one view. You can compare entries and conversion rates side by side, then spot which journeys are helping people convert, and which ones need attention.
That gives your team a clearer answer to a key question: "where should we focus first to improve sign-ups, sales or other important goals?" |
Then look at Forms to see what converts.
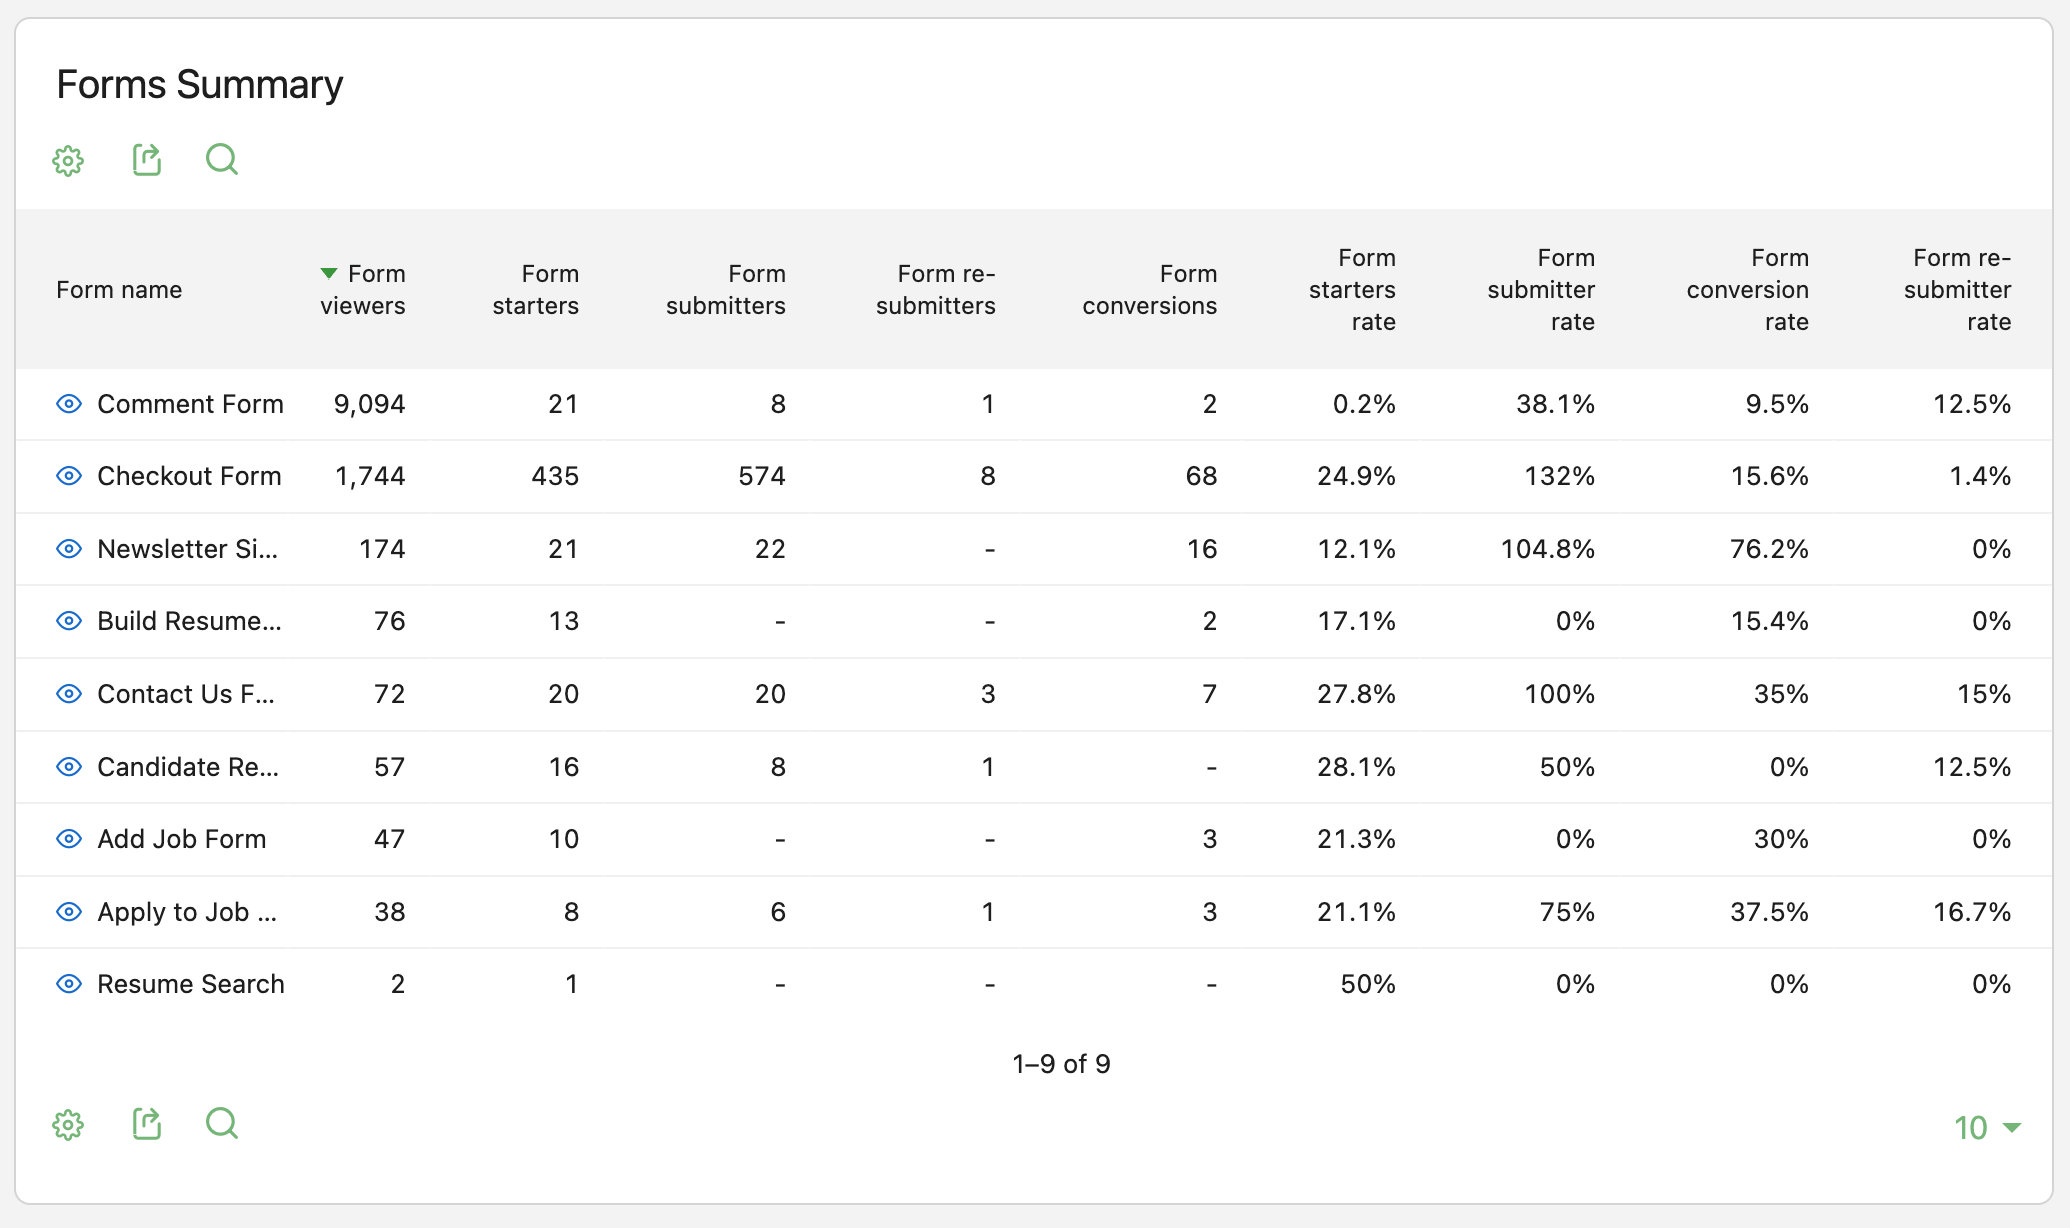
The new Forms Summary table shows how each form performs over the period you choose. You can compare submissions, conversions and engagement across all your forms in one place.
This helps you find forms that create friction, miss leads or underperform, so you can prioritise the fixes that have the biggest impact. |
Used together, the two tables connect the dots. Funnels show where people drop off. Forms help explain what may be blocking the next step.
Both tables are sortable and available as dashboard widgets, so your key conversion numbers stay easy to monitor. |
| | | |