
|
 |
Healthcare analytics built on structured data alone miss almost 40% of documented diagnoses
HEDIS rates from claims alone ran 20 points below chart-reviewed rates, Medicare claims found 2% smokers where the survey found 10%, and only 3% of documented suicidal ideation ever received a code.
|

| |||||||||||||||


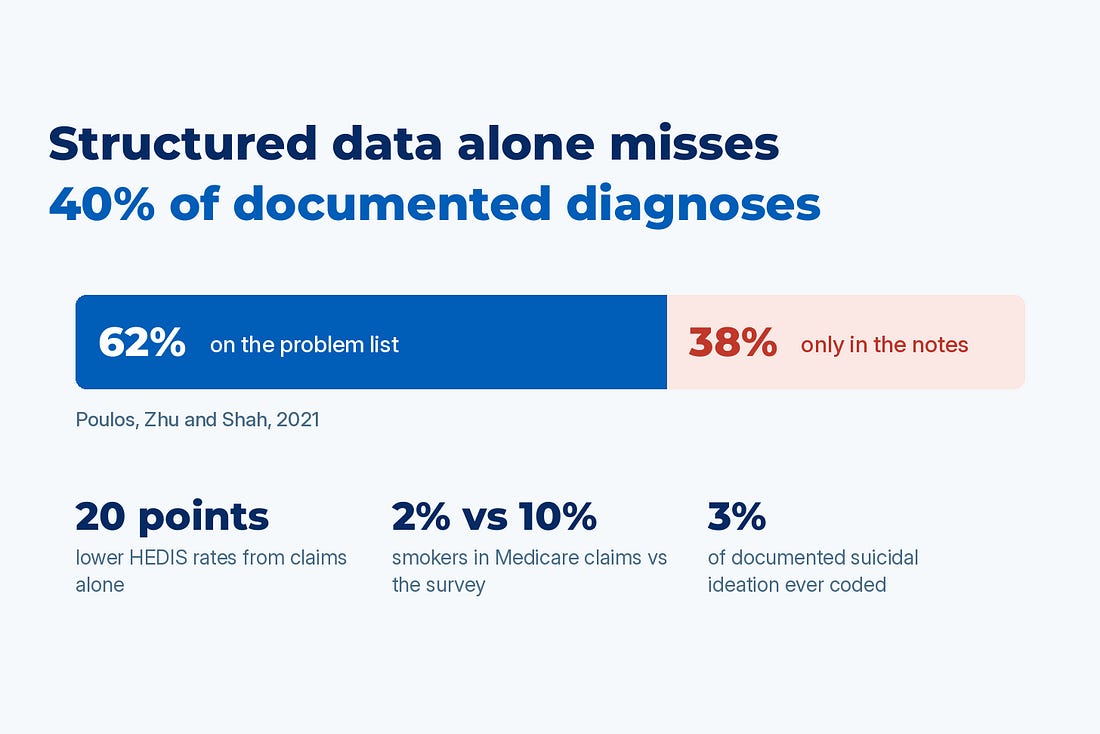 |
Every healthcare organization runs on measurements of its patients: which members have diabetes, which care gaps are open, how many patients smoke, how sick one hospital’s patients are compared with the hospital down the road. Nearly all of those measurements are computed from structured data, the fields software can read easily: diagnosis codes on claims, the problem list, lab results, medication orders. The rest of the record is unstructured: the notes, reports, and scanned documents that clinicians write and read, which is where most of what is known about a patient lives. Peer-reviewed studies that compare the two find that structured data alone misses almost 40% of documented diagnoses, two thirds of measured obesity, and 97% of documented suicidal ideation. All of that information is known and evidenced in the EHR, and the analytics never read it.
Why a missing code costs us
The damage from a measurement computed on half the record falls on three parties, and every figure in this section is documented with its source.
Patients
A patient whose lab results show chronic kidney disease but whose record carries no CKD diagnosis code is not in the CKD registry, does not trigger the nephrology referral, and is not on the list for the medications that slow the disease. In a Kaiser Permanente cohort below, that was 86% of the patients with the condition. A patient whose note says she has been thinking about suicide, but whose visit produced no matching code, is invisible to any prevention program that selects patients from codes; that was 97% of such patients in one primary care network. A smoker whose habit is recorded in the social history of every note and never coded is not offered cessation or lung cancer screening by any program that picks patients from claims.
Public health
Prevalence estimates built from claims report a fraction of the disease that exists. Medicare claims put current smokers at 2% when the survey of the same population put it at 10%, and the national inpatient dataset puts obesity at 15% while measured BMI puts it above 40%. Screening budgets, policy, and research built on those figures start from a number that is off by a factor of three.
Health plan finances
Health plans have known for two decades that quality rates computed from claims alone run about 20 points below the rates the chart supports, which is why they pay for an annual chart chase, and why Star ratings and pay-for-performance bonuses computed on the coded version understate the care that was delivered. Health systems in value-based contracts inherit the same gap, and Medicare Advantage plans carry it into risk adjustment audits, where the chart is the evidence and the code is the claim. In every one of these cases the information was in the record. It was missing from the part of the record the analytics read.
Analytics read the structured half of the record
The analytics stack that runs a health system, a payer, or a state Medicaid program is built almost entirely on structured fields, and everything downstream, from the HEDIS engine to the CMS-HCC risk model to the readmission dashboard, is SQL over those tables. That was a reasonable engineering choice when it was made: codes are standardized, computable, and cheap to query. In this piece, “codes” means the diagnosis and procedure codes that make up most of that structured data, and “the chart” means the complete record, structured and unstructured together.
The cost of reading only that half has been measured many times and rarely acted on. Veysel Kocaman, Dia Trambitas, and I built our AMIA Amplify 2026 session on regulatory-grade patient journey platforms around this evidence. A 2025 study in the Journal of Medical Internet Research took 1.8 million patients from a Dutch primary care database, extracted clinical concepts from the free-text notes, and checked how many had a structured counterpart in the same record. Thirteen percent did. The other 87% of what clinicians wrote about conditions, measurements, and drugs never became a code in that database. The studies below repeat that comparison one measure at a time, and every one of them finds the codes undercounting.
I’ve heard the anecdotal version at AMIA more than once: a state health data team whose claims show 5% of its members as smokers while the state’s own survey shows three times that. The peer-reviewed literature says that experience is typical.
Medicare claims found a fifth of the smokers surveys found
Smoking status is documented at nearly every encounter. It sits in the social history of every history and physical, on intake forms, and in nursing assessments, all of it unstructured text. It is also one of the facts least likely to reach structured data. A 2019 study in BMC Health Services Research compared tobacco diagnosis codes in Medicare claims against the CDC’s Behavioral Risk Factor Surveillance System for adults 65 and older. In 2001, claims identified 2.01% of beneficiaries as current smokers; BRFSS put the figure at 10.03%. By 2014, after a decade of quality programs and Meaningful Use incentives, the claims estimate had climbed to about 55% of the survey estimate, and the authors concluded that Medicare data still substantially underestimated tobacco use.
The sensitivity numbers explain why. A 2013 JAMIA study at Vanderbilt found ICD-9 tobacco codes had a specificity of 1.0 and a sensitivity of 0.32 in a general clinic population. The BMC authors note that this insensitivity is presumably why tobacco is left out of the standard claims-based comorbidity indices altogether. Smoking drives lung cancer screening eligibility, COPD and cardiovascular risk models, and the comorbidity adjustment behind outcome comparisons between hospitals, and a model that sees 2% smokers in a population where 10% smoke assigns the excess risk to something else.
The social history in the note holds the missing data, and that is the pattern this piece will repeat: the fact is documented, the code is absent, and reading the text recovers most of the gap.
Inpatient obesity is 42% by BMI and 15% by code
Obesity is the cleaner example because the reference standard is a number. Height and weight are stored as structured vitals inside the EHR, so BMI is computable there; the diagnosis code is what gets on the claim, and the code is what national datasets, payers, and most analytics see. A 2026 study in Obesity compared three national sources. The NHANES survey, which measures BMI directly, put adult obesity at 41.9%. NSQIP, which records BMI measured during a hospital stay, put inpatient obesity at 44.5%. The National Inpatient Sample, which relies on ICD-10 codes, put it at 15.4%. Any analysis that adjusts for obesity from claims, whether it is a hospital outcomes comparison, a GLP-1 utilization forecast, or a population health